> For the complete documentation index, see [llms.txt](https://developer.supervisely.com/llms.txt). Markdown versions of documentation pages are available by appending `.md` to page URLs; this page is available as [Markdown](https://developer.supervisely.com/app-development/widgets/charts-and-plots/confusionmatrix.md).
# ConfusionMatrix
## Introduction
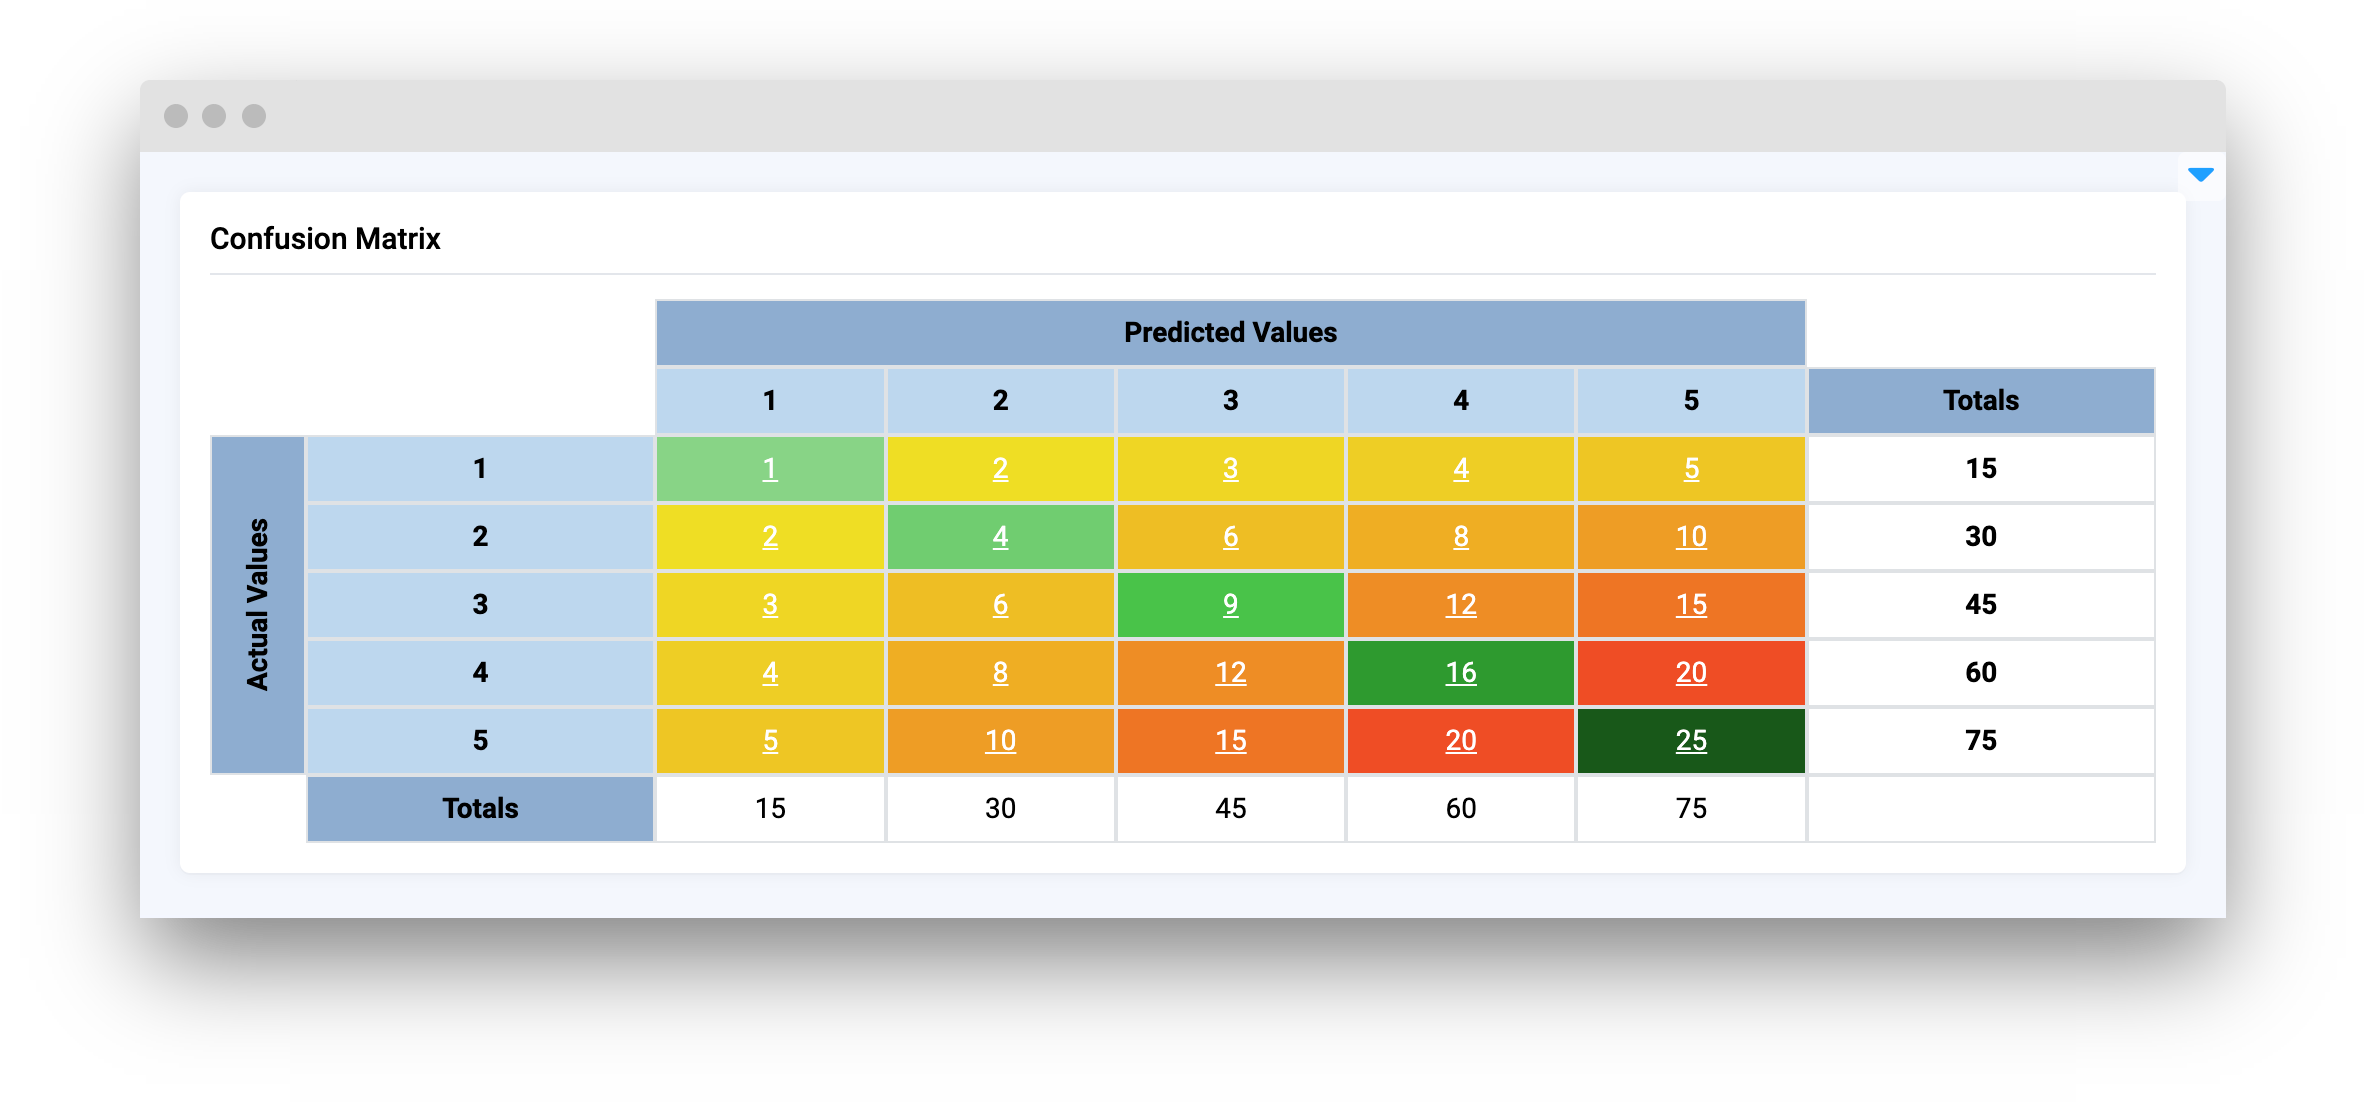
**`ConfusionMatrix`** is a widget that display a given confusion matrix with color-coded visualization for better interpretation. It also shows row and column totals.
`ConfusionMatrix` allows users to customize the axis labels, detect cell clicking events, and control it from Python code.
## Function signature
prepare data for widget
```python
a = list(range(1, 11))
b = list(range(1, 5))
data = []
for row in b:
temp = [round(row * number, 1) for number in a]
data.append(temp)
confusion_matrix = ConfusionMatrix(
data=pd.DataFrame(data=data, index=b, columns=a),
columns=a,
x_label="X",
y_label="Y",
widget_id=None
)
```
or
```python
confusion_matrix = ConfusionMatrix()
confusion_matrix.read_pandas(data=pd.DataFrame(data=data, index=b, columns=a))
```
## Parameters
| Parameters | Type | Description |
| :---------: | :------------------------: | :-------------------: |
| `data` | `pd.DataFrame()` or `dict` | Matrix table data |
| `columns` | `list` | List of columns names |
| `x_label` | `str` | Columns label |
| `y_label` | `str` | Rows label |
| `widget_id` | `str` | ID of the widget |
### data
Matrix table data in different formats:
1. Pandas Dataframe
```python
pd.DataFrame(data=data, columns=columns)
```
2. Python dict with structure
```python
{
"columns_names": ["col_name_1", "col_name_2", ...],
"values_by_rows": [
["row_1_column_1", "row_1_column_2", ...],
["row_2_column_1", "row_2_column_2", ...],
...
]
}
# prepare data for table
a = list(range(1, 11))
b = list(range(1, 5))
data = []
for row in b:
temp = [round(row * number, 1) for number in a]
data.append(temp)
a = [str(i) for i in a]
b = [str(i) for i in b]
data = pd.DataFrame(data=data, index=b, columns=a)
confusion_matrix = ConfusionMatrix(data=data)
```
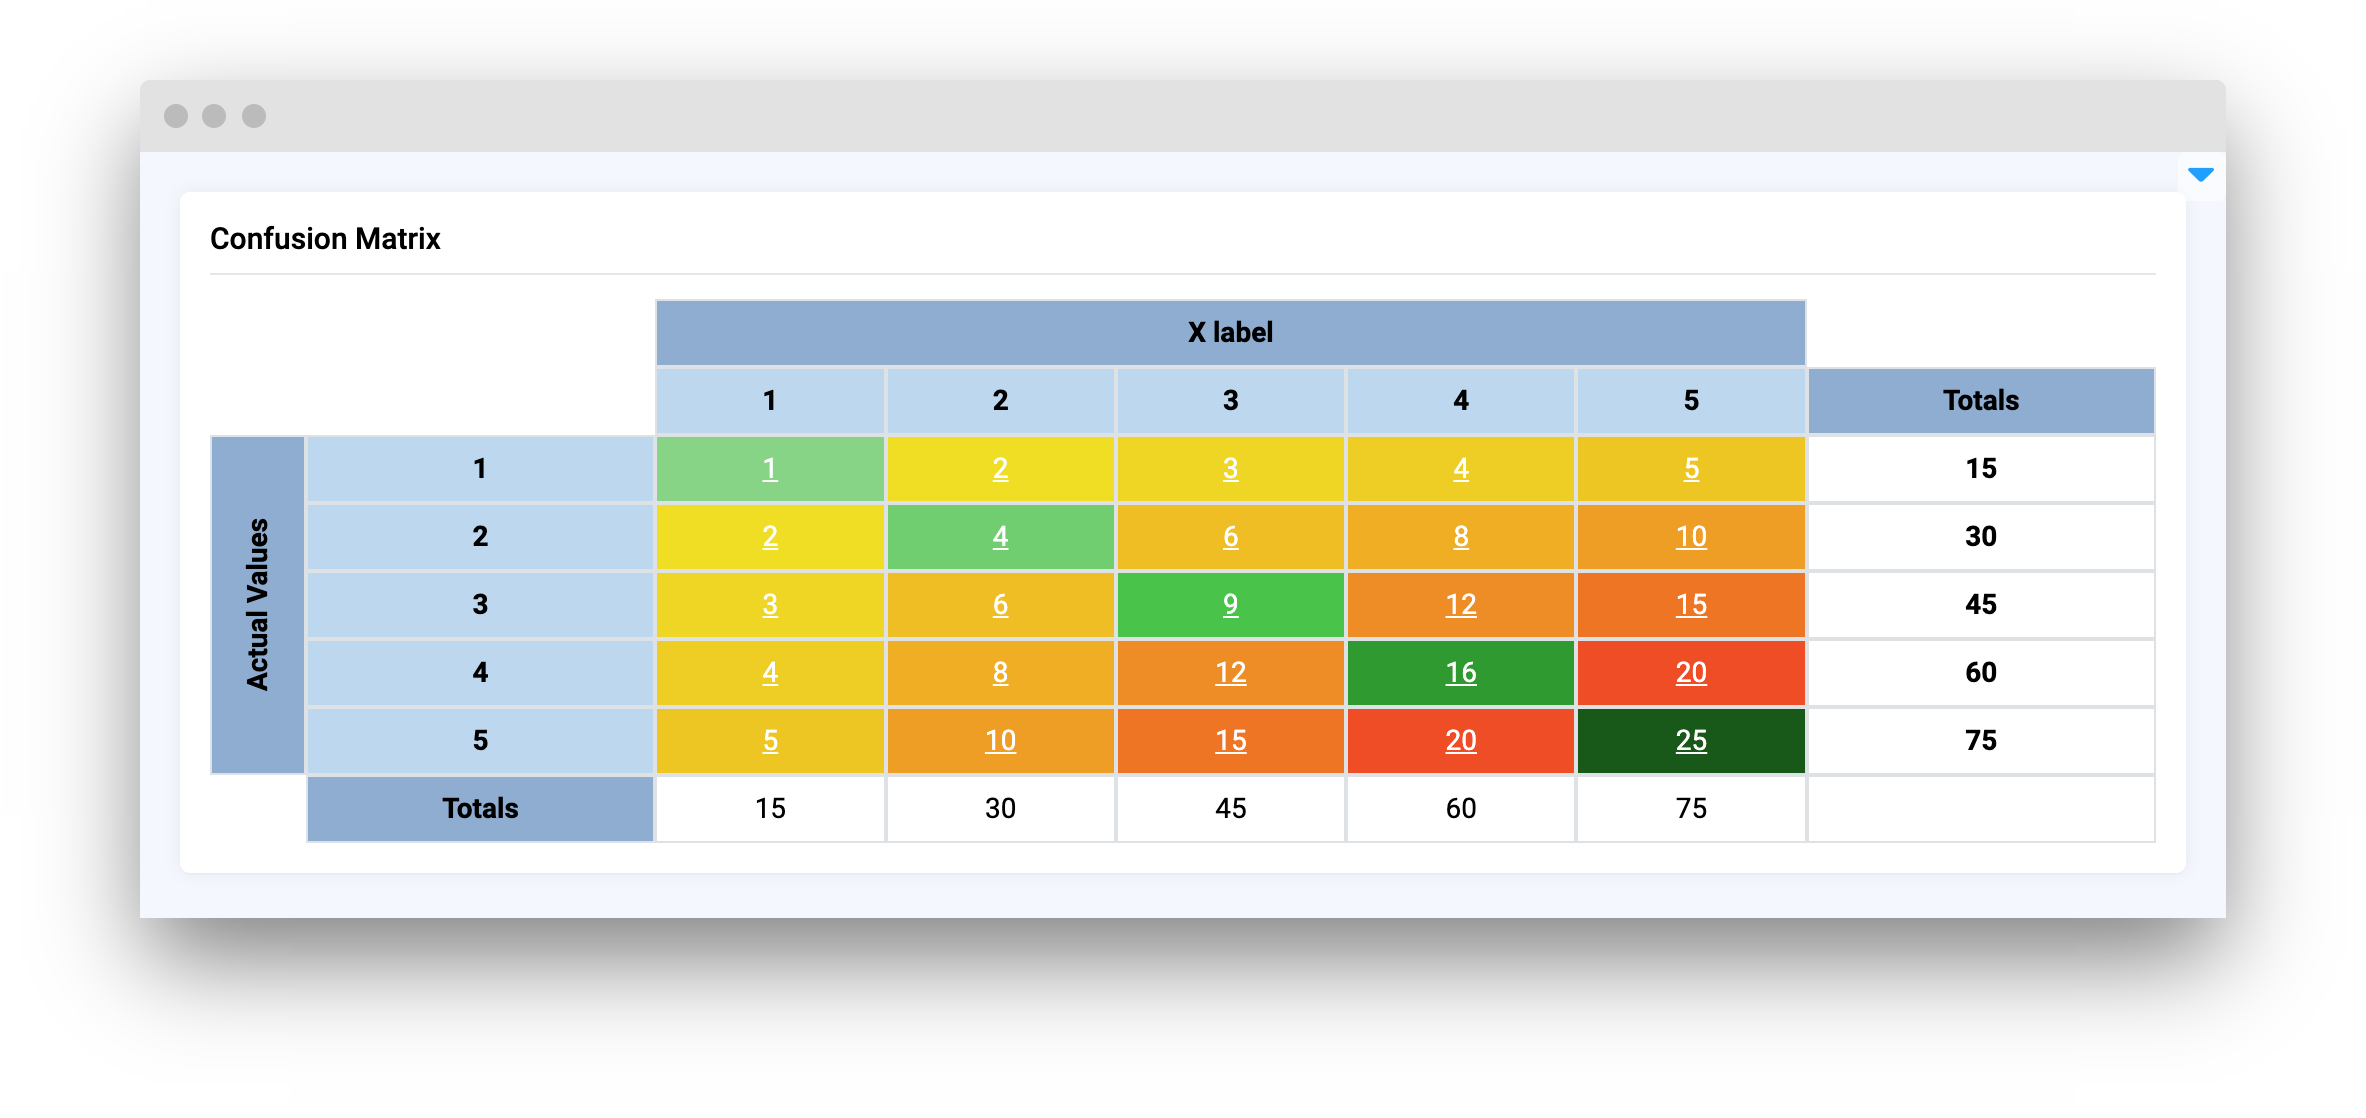
### x\_label
Columns label.
**type:** `str`
**default value:** `"Predicted Values"`
```python
data = pd.DataFrame(data=data, index=b, columns=columns)
confusion_matrix = ConfusionMatrix(data=df, x_label="X label")
```
### y\_label
Rows label.
**type:** `str`
**default value:** `"Actual Values"`
```python
data = pd.DataFrame(data=data, index=b, columns=columns)
confusion_matrix = ConfusionMatrix(data=df, y_label="Y label")
```
### widget\_id
ID of the widget.
**type:** `str`
**default value:** `None`
## Methods and attributes
| Attributes and Methods | Description |
| :--------------------------------: | --------------------------------------------------------- |
| `loading` | Get or set table `loading` status property. |
| `to_json()` | Convert table data to json. |
| `to_pandas()` | Convert table data to pandas dataframe. |
| `read_json(value: dict)` | Read and set table data from json. |
| `read_pandas(value: pd.DataFrame)` | Read and set table data from pandas dataframe. |
| `get_selected_cell(state)` | Get selected table cell info. |
| `@click` | Decodator function is handled when table cell is pressed. |
## Mini App Example
You can find this example in our Github repository:
[ui-widgets-demos/charts and plots/004\_confusion\_matrix/src/main.py](https://github.com/supervisely-ecosystem/ui-widgets-demos/blob/master/charts%20and%20plots/004_confusion_matrix/src/main.py)
### Import libraries
```python
import os
import pandas as pd
import supervisely as sly
from dotenv import load_dotenv
from supervisely.app.widgets import Card, ConfusionMatrix, Container
```
### Init API client
First, we load environment variables with credentials and init API for communicating with Supervisely Instance:
```python
load_dotenv("local.env")
load_dotenv(os.path.expanduser("~/supervisely.env"))
api = sly.Api()
```
### Prepare function that creates example pandas table
```python
def multiplication_table():
a = list(range(1, 6))
b = list(range(1, 6))
# len(a) has to be equal len(b)
data = []
for row in b:
temp = [round(row * number, 1) for number in a]
data.append(temp)
a = [str(i) for i in a]
b = [str(i) for i in b]
return pd.DataFrame(data=data, index=b, columns=a)
```
Create data for table.
```python
df = multiplication_table()
```
### Initialize `ConfusionMatrix` widget
```python
confusion_matrix = ConfusionMatrix()
confusion_matrix.read_pandas(df)
```
### Create app layout
Prepare a layout for app using `Card` widget with the `content` parameter and place widget that we've just created in the `Container` widget.
```python
card = Card(
title="Confusion Matrix",
content=confusion_matrix,
)
layout = Container(widgets=[card])
```
### Create app using layout
Create an app object with layout parameter.
```python
app = sly.Application(layout=layout)
```